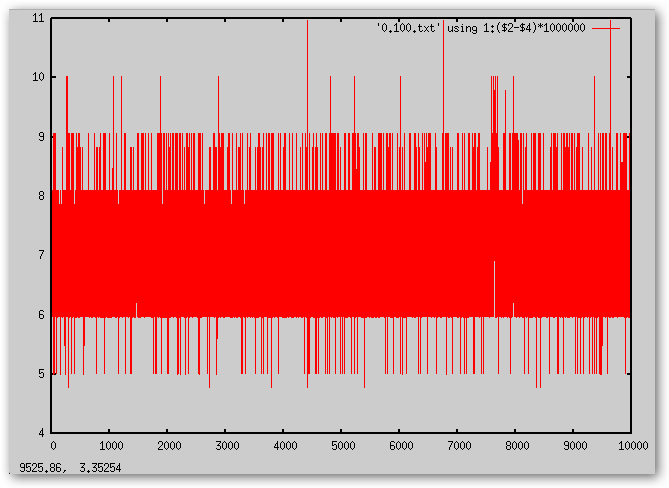
2. rep=10000 usec=100000 (0.100 sec x 10000) Graph of ISR_timestamp - pulse_timestamp shows worst case of 11 usec.
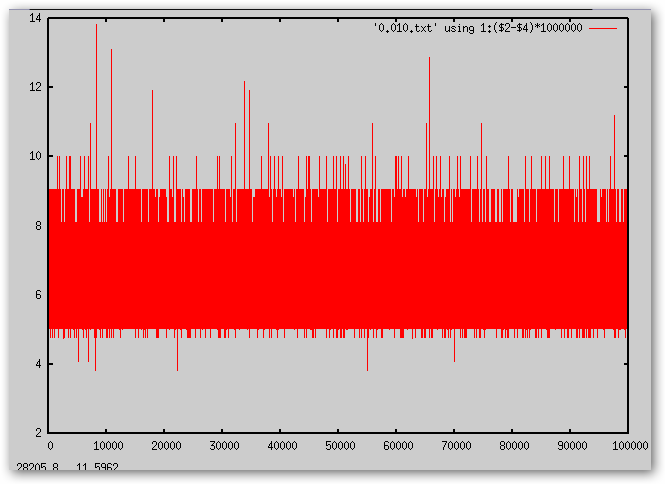
3. rep=100000 usec=10000 (0.010 sec x 100000) Graph of ISR_timestamp - pulse_timestamp shows worst case of 14 usec.
4. rep=100000 usec=1000 (0.001 sec x 100000) (The pulses loop actually ran at about 0.002 ). Graph of ISR_timestamp - pulse_timestamp shows worst case of 300 usec. All other samples are under 40 usec.
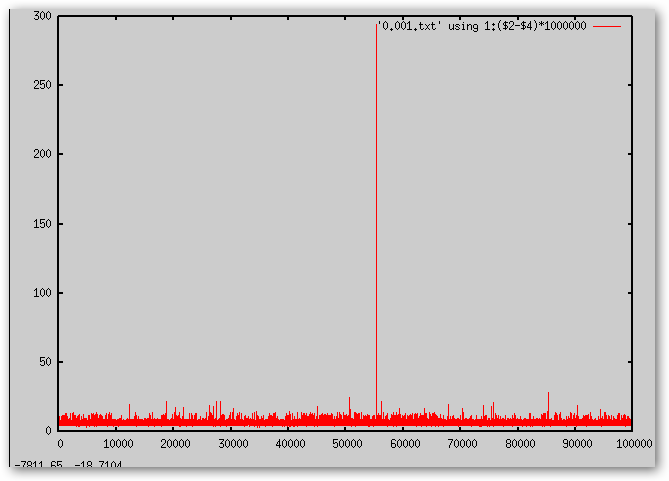
"Looks like parint could provde ~100 resolution microseconds 99.99% of the time."