Isophotal wavelengths, isophotal frequencies, and flux densities for Vega for the MKO-NIR filters
A.T. Tokunaga (Institute for Astronomy, Univ. of Hawaii)
W.D. Vacca (SOFIA/USRA, NASA Ames Research Center)
The Mauna Kea Observatories Near-Infrared filter set is defined in the papers by D.A. Simons and A.T. Tokunaga (2002, PASP, 114, 169) and A.T. Tokunaga, D.A. Simons, and W.D.Vacca (2002, PASP, 114, 180). These filters were designed to minimize the effects of water vapor at observatories at altitudes of greater than or equal to 2 km. Additional information on these filters can be found at: www.ifa.hawaii.edu/~tokunaga/. Cold filter scans can be found at: http://irtfweb.ifa.hawaii.edu/~nsfcam/filters.html.
The isophotal wavelengths, isophotal frequencies, and flux densities for Vega were published in Tokunaga and Vacca (2005, PASP, 117, 421); note the erratum. A summary of the results are shown in the following tables. The Z and Y filters (0.921 and 1.036 microns respectively) used by the UKIRT Wide-Field Camera have been added to the tables below. For information on WFCAM, see www.jach.hawaii.edu/UKIRT/instruments/wfcam/
| λiso | Fλ | |
| (μm) | (W/m2/μm) | |
| V | 0.5450 | 3.58E-08 |
| Z | 0.9206 | 8.74E-09 |
| Y | 1.036 | 5.81E-09 |
| J | 1.250 | 3.01E-09 |
| H | 1.644 | 1.18E-09 |
| K' | 2.121 | 4.57E-10 |
| Ks | 2.149 | 4.35E-10 |
| K | 2.198 | 4.00E-10 |
| L' | 3.754 | 5.31E-11 |
| M' | 4.702 | 2.22E-11 |
TABLE 2. Isophotal frequency, flux density, and AB mag for Vega.
| νiso | Fν | AB mag | |
| (Hz) | (Jy) | --- | |
| V | 5.490E+14 | 3630 | 0.026 |
| Z | 3.071E+14 | 2270 | 0.535 |
| Y | 2.870E+14 | 2060 | 0.64 |
| J | 2.394E+14 | 1560 | 0.941 |
| H | 1.802E+14 | 1040 | 1.38 |
| K' | 1.413E+14 | 686 | 1.84 |
| Ks | 1.395E+14 | 670 | 1.86 |
| K | 1.364E+14 | 645 | 1.90 |
| L' | 7.982E+13 | 249 | 2.93 |
| M' | 6.350E+13 | 163 | 3.40 |
Some comments about the continuum of Vega. The continuum of Vega is not a blackbody for several reasons. First the Balmer, Paschen, and Brackett jumps cause breaks in the spectrum. The following figure shows the continuum of Vega at the wavelengths of the filters from Table 1. The figure shows the continuum from the model adopted by Tokunaga and Vacca (2005).Notes:
- The values in these tables are strictly valid only for A0 stars. For stars of other spectral types or objects with a different spectral energy distribution it is necessary to apply a correction to the flux density. See M.S. Hanner, A.T. Tokunaga, G.J. Veeder, and M.F. Ahearn, 1984, AJ, 89, 162 for a discussion of how to compute the correction factor.
- νiso is not equal to c/λiso. νiso and λiso must be computed using equations (5) and (6) in Tokunaga and Vacca (2005). One could use νpivot and λpivot (see Tokunaga and Vacca for the definitions) if the equality ν = c/λ is desired.
- For the above reason, Fν and AB mags should always be plotted with νiso and Fλ with λiso.
- In Tokunaga and Vacca (2005) we derive an expression for the AB magnitude for Vega that is based on recent assessments of the absolute flux density for Vega. This expression is AB = −2.5 log(Fν) + 8.926, where Fν is in Jy. The constant in this definition differs slightly from that used by the Sloan Digital Sky Survey.
- The corresponding information shown here can also be found at the following UKIRT web site: http://www.jach.hawaii.edu/UKIRT/astronomy/utils/conver.html
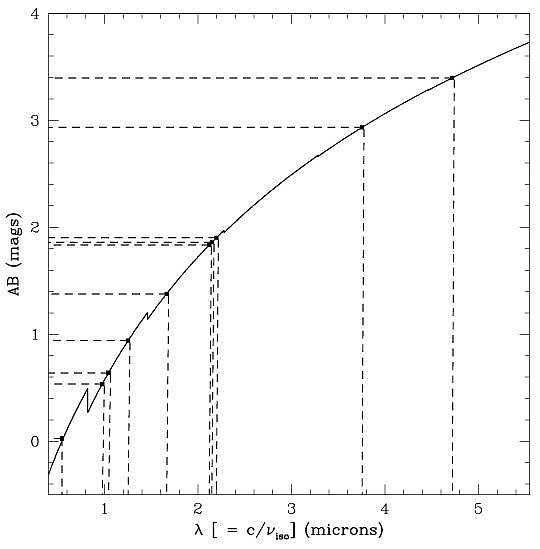
Fig. 1. Continuum of Vega. Wavelengths corresponding to the isophototal frequencies of MKO-NIR filters are indicated.A second reason that Vega is not a blackbody is that Vega is thought to be observed almost pole-on. The polar regions of Vega are hotter than the equatorial regions as we view it. Thus a standard atmospheric model will not be able to reproduce the flux from Vega, and in fact there is no published model for Vega that is correct simultaneously at visible and infrared wavelengths. This means that atmospheric models normalized at V underestimate the infrared flux density of Vega by a few percent. Further details can be found in Tokunaga and Vacca (2005) and R.C. Bohlin and R.L. Gilliland 2004, AJ, 127, 3508.
[Note: In the above figure, we have plotted c/νiso on the x-axis and this is appropriate. This is not equivalent to plotting λiso on the x-axis.]
Vega is surrounded by warm dust, and as a result at wavelengths longer than 10 um there is strong infrared excess emission. This is shown in the next figure.
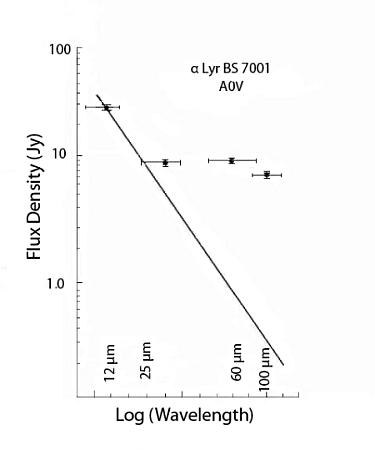
Fig. 2. Spectral energy distribution of Vega from the IRAS spacecraft. The solid line is the Rayleigh-Jeans extrapolation of the photospheric emission from the near infrared. Figure is adapted from D. Backman (2004, in Debris Disks and the Formation of Planets: A Symposium in Memory of Fred Gillett, ASP Conf. Ser., vol. 324, eds. L. Caroff, L.J. Moon, D. Backman, and E. Praton, p. 9). However it is important to note that there is no evidence for an infrared excess at 1-5 μm.
From the Spitzer Space Telescope, Su et al. (2005, astro-ph/0504086) the dust surrounding Vega is found to be in a flattened disk structure that is being viewed nearly face on. The extent of the disk is large: 43 arcsec in radius at 24 um and 105 arcsec in radius at 160 um.
Cohen et al. (1992, AJ, 104, 1650) recommend the use of Sirius as the primary absolute flux density standard. Sirius is also accessible from both the northern and southern hemispheres.